
DynaMax Suite has many tools to aid you in your analysis. Here are just some of the standard features in the base license. If you wish to see some of the optional licensed features click here: DynaMax Options
Cross-platform support between recorder models
DynaMax Suite is designed to support ALL IST recorders regardless of model. It currently supports the entire EDR3, MSR, and SnapShock Plus lines of recorders. This means that you can analyze data using the same program interface regardless of the IST recorder that you use.
Easy-to-use data export utilities into ASCII format
DynaMax Suite has several different means for exporting data into an ASCII Comma-Separated-Variable(CSV) format. This is the standard import format used by common programs such as Excel, DaDISP, and other spreadsheets or mathematical analysis packages.
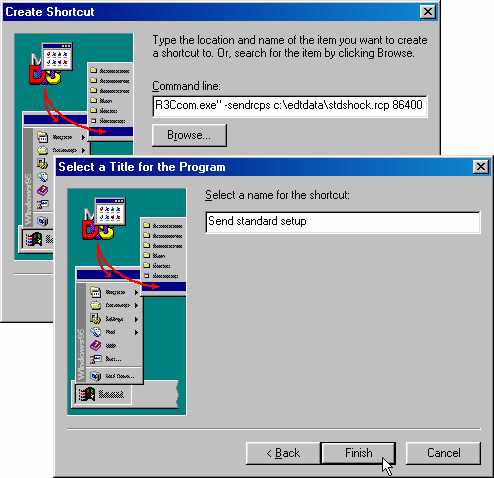
"Command-Line" Switch operation for FULLY-AUTOMATED setup and download!
The communications packages that interact with the recorders are designed to operate in many different modes. One of these new modes is a batch-process that uses an advanced set of command-line-switches. This means that you can design a recorder setup, then program the recorder with a simple "double-click" of a pre-configured desktop shortcut! You can then simply "click & go" when you want to start up the recorder for another test.
Multiple recorder association in a single file
A lot of the innovations of DynaMax Suite are provided in the standard configuration. These new analysis tools quite literally "leapfrog" the competition in terms of WHAT you can do with your data. Couple these capabilities with an IST data recorder and you have the best miniature shock & vibration data recorder system in the industry! Just take a look at a few of the standard features that simplify your analysis:
Graphics-oriented views of data:
With the advent of today's graphics intensive computers, graphical representation of your data has become paramount. To that end, DynaMax Suite does not disappoint. There are a myriad of ways to display data. DynaMax Suite displays many types of data: Tabular data, time-history data, frequency domain data, and more. Some of these views are available as license options whereas many are available in the standad package. Here are just some of the ways to graphically visualize your data. Best of all, these are all included in the standard package!
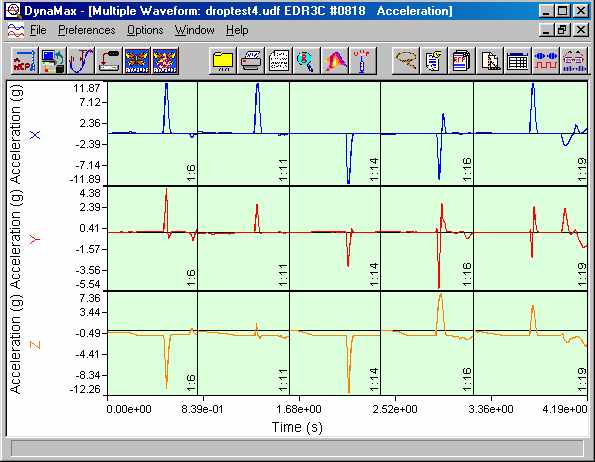
Multwave View
Multiwave is a very configurable window that serves as a way to visualize lots of time-history data. This view can contain many different graphs, each of which can display multiple events and multiple channels. Multiwave is handy when you have events that occur over several event boundaries, or if you are looking for trends in the data.
Cursor View
Cursor view gets its name from the cursors that you can "slide" across the data. Cursor view lets you compare one event versus another through the use of the event overlay function. The cursors are attached to a tabular event table at the bottom of the view, and this data lets you measure the data that lies between the cursors. Do you want to know the integral of the initial impact? Slide the cursors to sandwich the impulse, and the event table shows the integral between the cursors! Measurement is quite easy with cursor view. Cursor view has LOTS of useful features, like the ability to "slide forward or backward" events in the overlay. Cursor view may also be locked in as a "one-hot" event. "One-hot" events link windows to one another, so that when one window moves to a new event, all windows move. Cursor View can display more than acceleration data: It applies to any active channel set, including environmental data such as temperature and humidity.
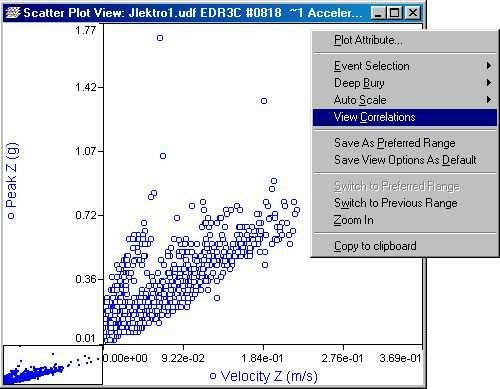
Scatter Plot View
Scatter plot lets you configure the X & Y axis for displaying tabular data against one another. Do you wish to see peak acceleration versus change-in-velocity? Place peak acceleration in the Y-axis, and set the X-axis to Delta-V. Damage assessment of data is now accomplished in a matter of a minute or two.
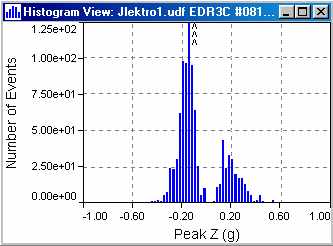
Histogram View
Histogram data lets you view the "spread" of the data for a given axis. Configuring the histogram is quite easy now, as all you have to do is "right-click" on the view to set your options. Do you want to look at absolute values? No problem. You can specify the histogram to display signed or absolute values in any axis.
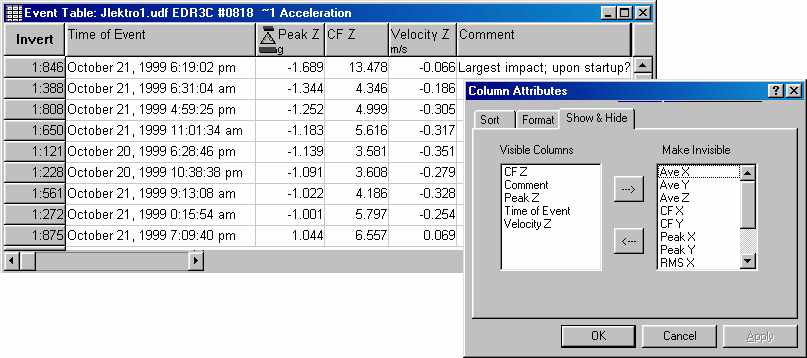
Event Table
DynaMax still has the traditional display of tabular data in the event table. Only now, you have the ability to sort by column, hide, or show the data, add comments to each event, or set as a "one-hot" event. You can also "copy selected events to clipboard", and quickly import into your favorite spreadsheet program.
SampleView Table
If you wish to select a portion of an event and export it, SampleView table lets you accomplish this in an easy manner. SampleView table is also a handy way to view environmental data such as temperature and humidity. SampleView translates a time and date for each environmental sample to help you find and identify when a certain anomaly occurred. Sampleview lets you view your data on a sample-by-sample basis.
Powerful data reduction tools:
DynaMax is designed to help simplify the process of data analysis. The task of gathering the data is only the beginning of a test. Once gathered, you must ask yourself "what is this data telling me?" Well, DynaMax Suite is designed to make your task easier. Your data is organized into discrete "events", and these events fall between various time blocks. You can look at the whole data set, multiple time blocks, individual time blocks, or discrete, single events. You can look at waveforms, tabular data, or statistical summaries. All of these analysis techniques are available in DynaMax. All of these techniques are aided through tools designed to "chop" your analysis into more manageable segments.
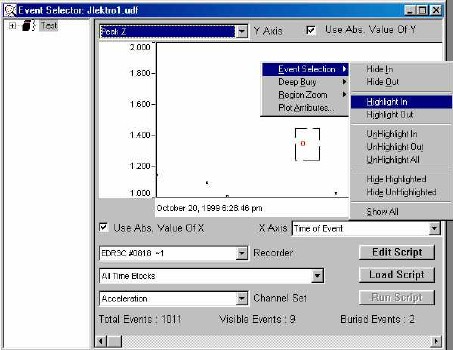
Event Selector view, Event tables, summary data plots
- The event selector view is the first to appear when you open a file. It shows you at a glance the makeup of the file. File details such as the number of events, number of recorders, types of channels, and spread of the data are easy to find in this view. It is a very good tool for the initial analysis.
- An Event table helps you to view the tabular data. This tabular data yields a synopsis of each and every event. This tabular data can be sorted by column, as well as exported into a spreadsheet. You can also "hide" events temporarily in order to look at certain trends or subsets of data.
- Summary data provides you with a quick summary over the entire selected data set.
Hiding, showing, and other event-sorting techniques
Field data can be quite complex. The environment can change drastically during the test, such as changes due to weather, or a change in transport mode. (e.g. rail shipment thransferred to air shipment). These changes may necessitate different analyses, separate from one another. DynaMax offers several tools for sorting this data. Data can be "hidden away" for later analysis, enabling you to examine subsets of data with all of the DynaMax analysis tools.
Event categorization by time, and channel set
DynaMax can display data with time as an axis. Multiple channels can be plotted against one another even though they may not share the same sample rate. Channel sets are "groupings" of channels that go with one another, such as three acceleration channels that form a triaxial cluster. Channel sets typically are analyzed with one another. DynaMax also enables you to group channel sets together, such as in the case of two accelerometer sets, on the same test, but in different locations.
Customized scripts for automating the reduction process
Scripting is a feature that gives you the power to program customized functions unique to your application. Scripts can be used to "pre-analyze" your data, hiding events that occur below a certain acceleration level. Scripts can also be used to create new channel sets, such as a "resultant" channel made up of three axes.
Scripts can perform customized mathematical functions, like compensating the data for incorrectly entered transducer calibrations. In fact, scripts are based upon a subset of the C programming language, and allow for a nearly unlimited number of special functions. Use them to pre-sort your data, pre-process the data, or correct for offsets or incorrect transducer calibration. You can even fabricate synthetic signals from scratch!
Powerful Digital Processing and Analysis tools
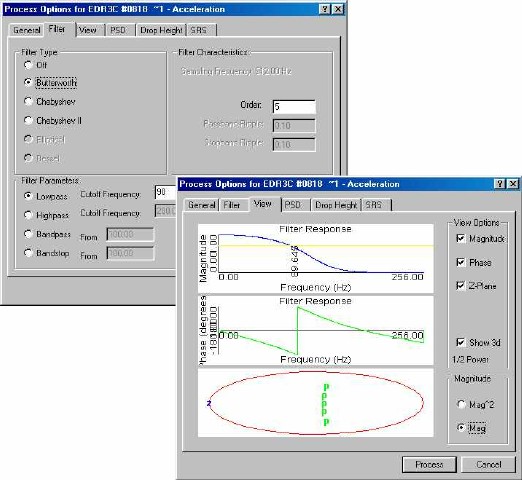
DynaMax uses the latest computer algorithms to give you high-performance digital filtering capabilities. You can choose from any number of poles, and any filter frequency you wish. DynaMax even has a filter characteristics plot that shows you the performance of the filter. Watch out though, there are no restrictions on filter characteristics. Therefore, you can tune your filter right to the edge of stability and beyond. DynaMax does not put you into a straight-jacket! You control the instrumentation, not the other way around. Here are some of the various filter types and features:
- Butterworth & Chebyshev 1 & 2
- High-pass, Low-pass, Band pass filtering
- 1-pole up to 20-poles and beyond
- Iterative tuning with plots of the actual -3db filter frequencies
- Z-plane plot for determining the stability of the filter design
Linear Trend Removal
Sometimes your data will experience a DC-offset. This can be due to a shift in recorder orientation, or a large temperature gradient. Linear trend removal can remove the DC component from your analysis. This is important in cases where you wish to measure the overall %rms vibration of an event, or if you wish to integrate the area under the curve for a discrete impact.
Mean removal
Similar to Linear Trend Removal, Mean removal determines the mean for each event, then subtracts it from every sample. Waveforms then integrate to net zero velocity change over the whole event, but still show transients in the integration.
What you see above is only a portion of what is available in the standard license for DynaMax Suite.
Want to see more? Check out the optional licenses that expand your recorder capabilities even more:
DynaMax optional licensed capabilities overview